More media 1
Show the original Reddit post
Description
So, I’m going over the AARO report to see if I may have missed something, somewhere. It turns out that I did. I missed this pie chart. It is a beautiful piece of visual design. Not only is it an easily interpretable way to display the proportion of UAPS that have lights, (21%) vs. those that do not have lights (79%). It’s also 3-d, which is exciting. Genuinely did not know that computer technology had come so far. What a time to be alive!
Comments 0
Sign in to join the discussion.
What do you think it is?
Sign in to vote. 0 votes.
👥 Other witnesses
🙋 I saw this tooSaw it too? Add your account — independent witnesses are the best evidence.
🔔 Alerts for sightings like this
Source
u/E05DCA on r/UFOs
Citations
https://www.reddit.com/r/UFOs/comments/17idje9/the_aaro_report_contai…
Similar sightings described alike
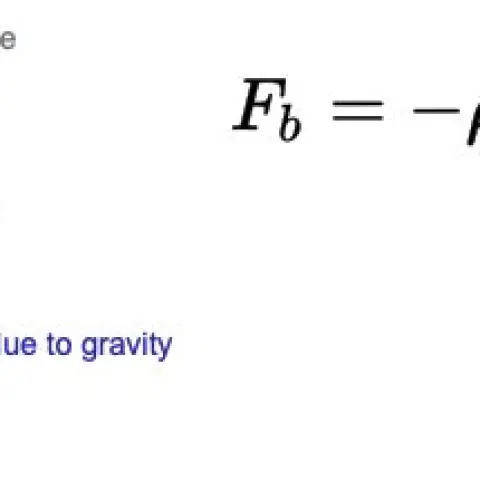 I've decided to open source my research into vacuum balloons and a potentially new approach to nano foams. This information is very interesting when compared to the UFO metal sphere analysis…
 The Golden-Haired, Bare-Skinned Alien of 1897Springfield
 Planetary consciousness, UFO’s, Artificial Intelligence and the „Abyss from there is no return“
 Do Historical “Sky Battles” Resemble Modern UAP Reports? A Source-Critical Study of Nuremberg 1561, Basel 1566, Stralsund 1665, and the PURSUE FilesNuremberg
 UAP Sightings in Puno, Peru - 12/24/2023Puno · 2023
 An Odd Response To A FOIA Request On Recovered UAP Materials Leads To Researching Spintronics Part 1 and 2 research consolidated into one placeRoswell
 AARO Senate Hearing - a detailed overview of the hearing and criticisms2024
 My observation - finally after 20 years I decided to present my story to a wider audience - UPDATE and some important topic
No comments yet. Start the conversation.