More media 2
Description
The NUFORC data has interesting witness statements on over 80k sightings. I asked it to summarize the sightings for Seattle. Here is what I found:
\# Seattle UFO Sightings Analysis Report
\## Executive Summary
Seattle, Washington represents one of the most active UFO sighting hotspots in the United States, with \*\*607 documented reports spanning 40 years (1972–2012)\*\*. This comprehensive analysis reveals distinctive patterns in sighting characteristics, temporal distribution, and geographic concentration.
\---
\## Key Findings
\### Volume & Timeline
\- \*\*Total Sightings:\*\* 607 incidents
\- \*\*Data Period:\*\* January 1972 – September 2012 (40 years)
\- \*\*Peak Activity:\*\* 2012 with 45 sightings, indicating increasing reporting rates in recent decades
\### Most Frequently Reported UFO Shapes
| Rank | Shape | Count | Percentage |
|------|-------|-------|-----------|
| 1 | \*\*Light\*\* | 127 | 20.9% |
| 2 | \*\*Fireball\*\* | 55 | 9.1% |
| 3 | \*\*Circle\*\* | 48 | 7.9% |
| 4 | \*\*Triangle\*\* | 43 | 7.1% |
| 5 | \*\*Sphere\*\* | 40 | 6.6% |
The dominance of "light" reports aligns with common UFO sighting descriptions emphasizing luminous phenomena rather than solid structures.
\### Duration Analysis
\*\*Statistical Summary:\*\*
\- \*\*Median Duration:\*\* \~90 seconds (1.5 minutes)
\- \*\*Mean Duration:\*\* \~545 seconds (9.1 minutes)
\- \*\*Range:\*\* 0.45 seconds to 18,000 seconds (5 hours)
\- \*\*Standard Deviation:\*\* 1,511 seconds
\*\*Duration Distribution:\*\*
\- \*\*Quick Sightings (<1 minute):\*\* 255 incidents (42.0%)
\- \*\*Moderate Duration (1–10 minutes):\*\* 211 incidents (34.8%)
\- \*\*Extended Observation (>10 minutes):\*\* 141 incidents (23.2%)
The histogram reveals a strong concentration of sightings lasting under 10 minutes, with a notable tail of extended observations exceeding several hours.
\---
\## Seasonal & Temporal Patterns
\### Monthly Distribution
\*\*Peak Season:\*\* Summer through early fall
\- \*\*Busiest Month:\*\* July with \*\*96 sightings (15.8%)\*\*
\- \*\*Top 5 Months:\*\* July, August, October, September, June
\- \*\*Summer Concentration:\*\* June–August account for approximately \*\*34% of all annual sightings\*\*
\- \*\*Lowest Activity:\*\* February and March
The pronounced summer peak suggests potential correlations with increased outdoor activities, weather conditions, and greater visibility during longer daylight hours.
\### Yearly Trend
The trend line (1990–2012) shows significant variability with notable peaks around 2001–2003 and again in 2012, suggesting potential clustering of reporting events or increased public awareness during specific periods.
\---
\## Geographic Characteristics
\*\*Sighting Epicenter:\*\*
\- \*\*Coordinates:\*\* 47.61°N latitude, 122.33°W longitude (Downtown Seattle vicinity)
\*\*Notable Concentration Areas:\*\*
\- Boeing Field
\- I-5 Corridor
\- Puget Sound waterfront
\- Seattle neighborhoods: Ballard, Northgate, West Seattle, Shoreline District
\- Specific landmarks: Discovery Park, Magnolia, Belmont & Pike intersection
The clustering around transportation corridors (I-5, Boeing Field) and waterways (Puget Sound) suggests correlation with major activity centers and atmospheric observation vantage points.
\---
\## Reporting Characteristics
\*\*Key Observations:\*\*
\- Reports frequently submitted years after the actual sighting occurred
\- Detailed witness accounts typically include:
\- Precise geographic locations and neighborhood references
\- Color and luminosity descriptions (orange, green, red, white, yellow)
\- Movement patterns and flight characteristics
\- Sound profiles (predominantly silent)
\- Multiple witness confirmations
\*\*Common Thematic Elements:\*\*
\- Bright, strobing light formations
\- Triangular configurations with corner-mounted lights
\- Hovering and sudden directional changes
\- Silent operation (noteworthy given sighting proximities to Seattle-Tacoma International Airport)
\---
\## Visualizations Summary
The accompanying charts illustrate:
1. \*\*Top UFO Shapes Bar Chart\*\* – Horizontal bar graph demonstrating "light" dominance with 127 reports, significantly exceeding other categories
2. \*\*Sighting Trends Over Time\*\* – Line graph showing volatile but generally increasing activity from 1990 onward, with peak in 2012
3. \*\*Duration Distribution Histogram\*\* – Logarithmic scale revealing concentration below 1,000 seconds with extended tail
4. \*\*Monthly Seasonality Pattern\*\* – Bar chart with pronounced July spike and secondary peaks in August and October
5. \*\*Shape Distribution Pie Chart\*\* – Visual breakdown showing "light" comprises 23.1%, with remaining categories distributed among "others" (26.7%)
6. \*\*Duration Categories Bar Chart\*\* – Comparative view showing 42% of sightings last under 1 minute
\---
\## Conclusion
Seattle's UFO sighting database reflects a substantial and geographically concentrated phenomenon characterized by brief, luminous observations with pronounced seasonal clustering in summer months. The prevalence of light-based reports and the geographic concentration around transportation corridors suggest potential relationships between visibility factors, air traffic, and witness observation patterns.
If you are interested in the same for your city, I can show you how.
Comments 0
Sign in to join the discussion.
What do you think it is?
Sign in to vote. 0 votes.
👥 Other witnesses
🙋 I saw this tooSaw it too? Add your account — independent witnesses are the best evidence.
🔔 Alerts for sightings like this
🌤️ Sky conditions weather, moon, planets, satellites, aircraft & launches at that time
Source
u/VerbaGPT on r/UFOs
Citations
https://www.reddit.com/r/UFOs/comments/1qd4kbn/summarizing_witness_st…
Nearby sightings within 100 miles
 Seen above Seattle last nightSame place
 Did anyone see this tonight in Seattle. Time: 10:43 PM Location: Seattle, WASame place
 Military Helicopter and Sphere near SeattleSame place
 I sighted this interdimensional energy drone orb!! Checkmate skepticsSame place
 7 UAP photos 196816 km · 10 mi
 The forgotten Scott Sylte photos: seven 🛸 shots over Boeing country, then the trail goes cold🤔16 km · 10 mi
 Object hovered and drifted erratically over Robert Morris Earthworks Park, SeaTac, WA — Aug 2, 2026, 7:08 PM18 km · 11 mi
 6 Objects Floating In Edmonds, WA23 km · 14 mi
 Mt. Rainier High Speed UAP (pics & video attached)26 km · 16 mi
 Taken last night moving eat to West over Kent, UK26 km · 16 mi
 UAP sighting 06/07/2025 Everett, WA43 km · 26 mi
 Triangular 3-light object floated above I-5 in Everett, WA — Oct 4, 2026, 8:49 PM43 km · 26 mi
Same shape, same week Triangle
Similar sightings described alike
 Do Historical “Sky Battles” Resemble Modern UAP Reports? A Source-Critical Study of Nuremberg 1561, Basel 1566, Stralsund 1665, and the PURSUE FilesNuremberg
 Is AARO Keeping Us in the Dark? Alleged Report Suggests UAPs Follow Intelligent Patterns While Pentagon Denials Persist
 In-depth Forensic Analysis of the Japanese Leaked 3IAtlas image.
 Emotion and Sentiment Analysis of 288K UFO Sighting Reports: Report Language Is Twice as Likely to Be Positive Over Negative, and Emotions Like Curiosity and Awe Outweigh Fear2026
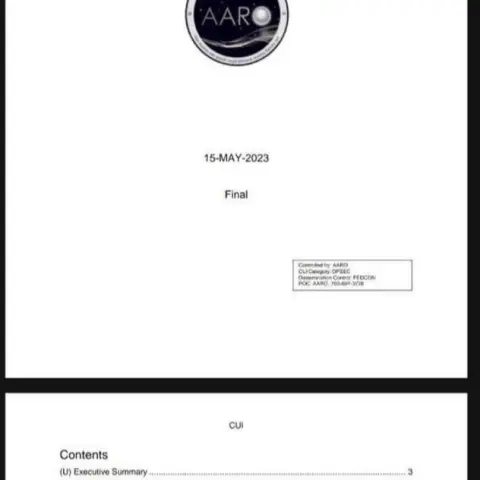 Alleged AARO Internal Report Analysis Reveals Major Inconsistencies Between Public and Internal Messaging
 "2027": Is there reasoning for the "2027" date being relevant to disclosure based strictly upon U.S. classification laws? (tl;dr: yes, potentially)2024
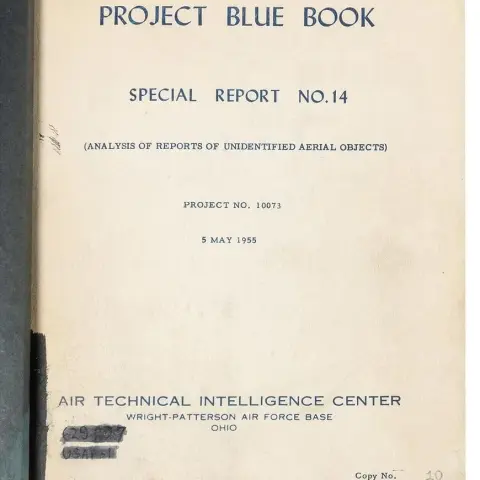 Found: first printing of Project Blue Book Special Report No. 14 (Analysis of Reports of Unidentified Aerial Objects). Project No. 10073. 5 May 1955.Wright-Patterson AFB
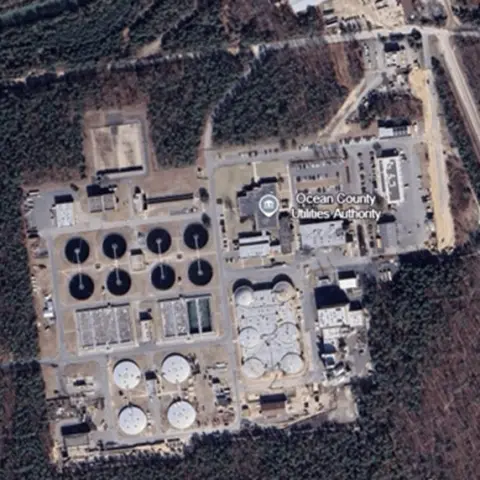 Forgotten Languages: New Jersey kinetic strike test: Threat Analysis of sUAV-driven attacksNew Jersey
No comments yet. Start the conversation.