More media 8
Description
I am the maker of an analytics app, and thought I would test it by analyzing a chunky dataset on UFO sightings that I found. Here are a few insights:
Data contains sightings from 1906-2014 (data link (https://www.kaggle.com/datasets/NUFORC/ufo-sightings)).
\- 33% of sightings in summer months (expected 25%)
\- 65% during nighttime (I actually expected even higher for some reason)
\- Seattle top city for sightings
\- Coastal concentration
\- and many more in the full analysis.
Full analysis + prompt + more visuals: https://app.verbagpt.com/shared/h\_hjPReaFEgxctMt4WodOcZPULnlntN8 (https://app.verbagpt.com/shared/h_hjPReaFEgxctMt4WodOcZPULnlntN8)
Comments 0
Sign in to join the discussion.
What do you think it is?
Sign in to vote. 0 votes.
👥 Other witnesses
🙋 I saw this tooSaw it too? Add your account — independent witnesses are the best evidence.
🔔 Alerts for sightings like this
Source
u/VerbaGPT on r/UFOs
Citations
https://www.reddit.com/r/UFOs/comments/1po5roc/i_analyzed_80000_ufo_s…
Similar sightings described alike
 All this talk about technology transfer to the private sector and speculations about mysterious finds in Antarctica look pretty interesting now that I'm investigating the history of Antarctic…
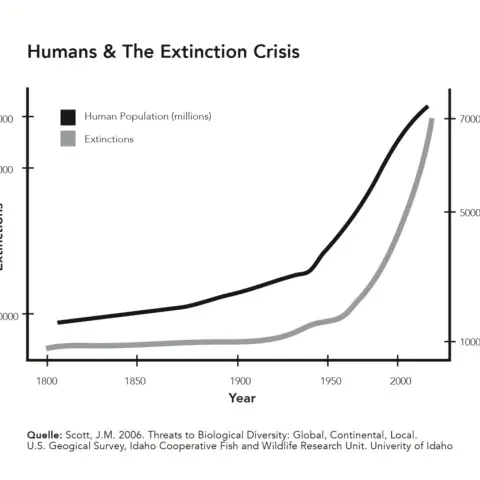 Planetary consciousness, UFO’s, Artificial Intelligence and the „Abyss from there is no return“
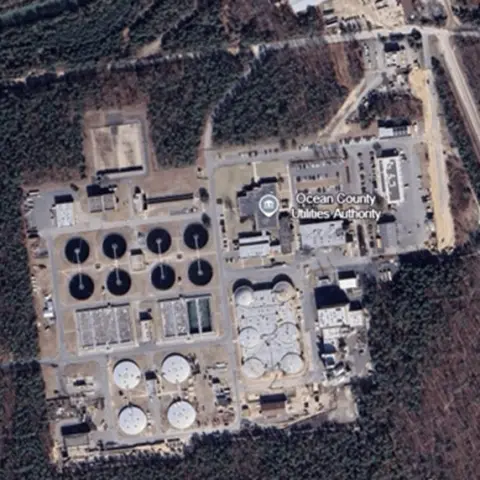 Forgotten Languages: New Jersey kinetic strike test: Threat Analysis of sUAV-driven attacksNew Jersey
 UAP Sightings in Puno, Peru - 12/24/2023Puno · 2023
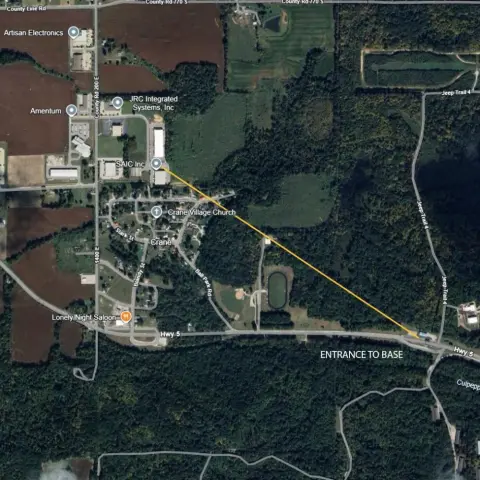 Naval Surface Warfare Center - Crane Division lets discussCrane
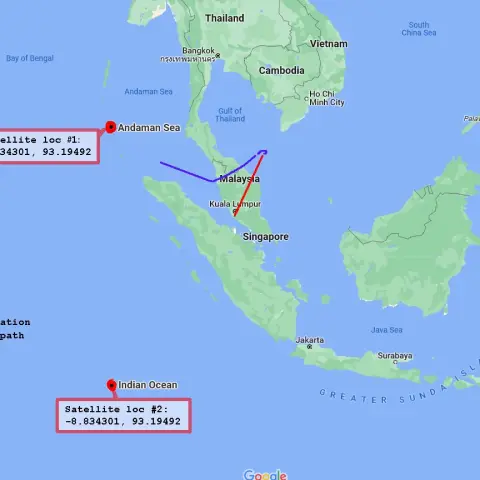 MH370 Airliner videos part III: The rabbit hole goes deeper than we thought2014
 I've decided to open source my research into vacuum balloons and a potentially new approach to nano foams. This information is very interesting when compared to the UFO metal sphere analysis…
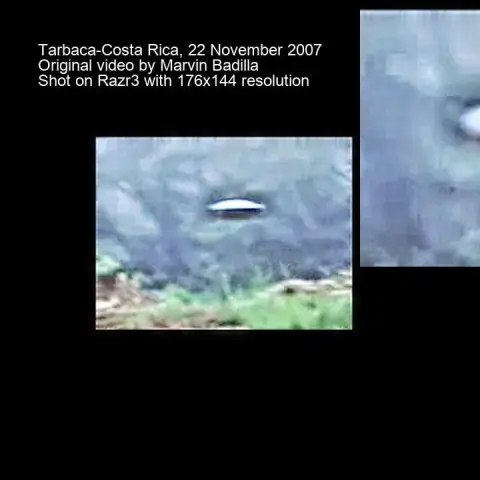 Let's Add Them Up: A Compilation of Alleged UFO videosGreat Falls
No comments yet. Start the conversation.