Map of UFO sightings in the United States
UFO sightings by state
| # | State | Sightings | Per 100k | Last 12 months |
|---|---|---|---|---|
| 1 |  California | 575 | 1.45 | 51 |
| 2 |  Arizona | 243 | — | 21 |
| 3 |  Florida | 197 | 0.91 | 21 |
| 4 |  New Mexico | 195 | 9.21 | 21 |
| 5 |  New York | 194 | 0.96 | 15 |
| 6 |  Nevada | 191 | 6.15 | 37 |
| 7 |  Texas | 168 | 0.58 | 22 |
| 8 |  New Jersey | 145 | 1.56 | 5 |
| 9 |  Washington | 108 | 1.40 | 9 |
| 10 |  Colorado | 106 | 1.84 | 9 |
| 11 |  Illinois | 87 | 0.68 | 14 |
| 12 |  Utah | 86 | 2.63 | 13 |
| 13 |  Pennsylvania | 83 | 0.64 | 16 |
| 14 |  Georgia | 78 | 0.73 | 11 |
| 15 |  North Carolina | 73 | 0.70 | 11 |
| 16 |  Virginia | 66 | 0.76 | 11 |
| 17 |  Ohio | 64 | 0.54 | 12 |
| 18 |  Maryland | 60 | 0.97 | 7 |
| 19 |  Oregon | 54 | 1.27 | 3 |
| 20 |  Massachusetts | 49 | 0.70 | 6 |
| 21 |  South Carolina | 41 | 0.80 | 4 |
| 22 |  Tennessee | 40 | 0.58 | 4 |
| 23 |  Michigan | 36 | 0.36 | 3 |
| 24 |  Missouri | 32 | 0.52 | 3 |
| 25 |  Connecticut | 27 | 0.75 | 3 |
| 26 |  Oklahoma | 24 | 0.61 | 0 |
| 27 |  Wisconsin | 23 | 0.39 | 3 |
| 28 |  Kentucky | 18 | 0.40 | 2 |
| 29 |  Kansas | 17 | 0.58 | 1 |
| 30 |  Hawaii | 15 | 1.03 | 0 |
| 31 |  Minnesota | 15 | 0.26 | 3 |
| 32 |  New Hampshire | 15 | 1.09 | 0 |
| 33 |  Alabama | 15 | 0.30 | 0 |
| 34 |  Louisiana | 14 | 0.30 | 0 |
| 35 |  Montana | 14 | 1.29 | 1 |
| 36 |  Idaho | 13 | 0.71 | 2 |
| 37 |  Nebraska | 12 | 0.61 | 3 |
| 38 |  Alaska | 12 | 1.64 | 1 |
| 39 |  Indiana | 11 | 0.16 | 1 |
| 40 | District of Columbia | 9 | 1.31 | 0 |
| 41 |  Wyoming | 8 | 1.39 | 0 |
| 42 |  Maine | 7 | 0.51 | 1 |
| 43 |  Arkansas | 7 | 0.23 | 2 |
| 44 |  Mississippi | 6 | 0.20 | 0 |
| 45 |  Rhode Island | 6 | 0.55 | 1 |
| 46 |  West Virginia | 4 | 0.22 | 0 |
| 47 |  South Dakota | 4 | 0.45 | 1 |
| 48 |  Iowa | 3 | 0.094 | 0 |
| 49 |  North Dakota | 3 | 0.39 | 0 |
| 50 |  Delaware | 3 | 0.30 | 0 |
When UFOs are seen in the United States
Show as a table
| Sightings per month | Sightings |
|---|---|
| Dec 2024 | 689 |
| Jan 2025 | 221 |
| Feb 2025 | 98 |
| Mar 2025 | 79 |
| Apr 2025 | 73 |
| May 2025 | 87 |
| Jun 2025 | 83 |
| Jul 2025 | 80 |
| Aug 2025 | 71 |
| Sep 2025 | 89 |
| Oct 2025 | 78 |
| Nov 2025 | 85 |
| Dec 2025 | 60 |
| Jan 2026 | 59 |
| Feb 2026 | 49 |
| Mar 2026 | 56 |
| Apr 2026 | 51 |
| May 2026 | 66 |
| Jun 2026 | 71 |
| Jul 2026 | 42 |
| Aug 2026 | 19 |
| Sep 2026 | 16 |
| Oct 2026 | 14 |
| Nov 2026 | 1 |
Show as a table
| Sightings per year | Sightings |
|---|---|
| 1903 | 1 |
| 1904 | 0 |
| 1905 | 0 |
| 1906 | 0 |
| 1907 | 0 |
| 1908 | 0 |
| 1909 | 0 |
| 1910 | 0 |
| 1911 | 0 |
| 1912 | 0 |
| 1913 | 0 |
| 1914 | 0 |
| 1915 | 0 |
| 1916 | 0 |
| 1917 | 0 |
| 1918 | 0 |
| 1919 | 0 |
| 1920 | 0 |
| 1921 | 0 |
| 1922 | 0 |
| 1923 | 0 |
| 1924 | 0 |
| 1925 | 0 |
| 1926 | 0 |
| 1927 | 0 |
| 1928 | 0 |
| 1929 | 0 |
| 1930 | 0 |
| 1931 | 0 |
| 1932 | 0 |
| 1933 | 0 |
| 1934 | 0 |
| 1935 | 0 |
| 1936 | 0 |
| 1937 | 0 |
| 1938 | 0 |
| 1939 | 0 |
| 1940 | 0 |
| 1941 | 0 |
| 1942 | 3 |
| 1943 | 0 |
| 1944 | 0 |
| 1945 | 0 |
| 1946 | 0 |
| 1947 | 2 |
| 1948 | 1 |
| 1949 | 0 |
| 1950 | 7 |
| 1951 | 3 |
| 1952 | 6 |
| 1953 | 1 |
| 1954 | 1 |
| 1955 | 1 |
| 1956 | 0 |
| 1957 | 1 |
| 1958 | 0 |
| 1959 | 1 |
| 1960 | 0 |
| 1961 | 0 |
| 1962 | 1 |
| 1963 | 0 |
| 1964 | 1 |
| 1965 | 9 |
| 1966 | 4 |
| 1967 | 3 |
| 1968 | 3 |
| 1969 | 1 |
| 1970 | 0 |
| 1971 | 0 |
| 1972 | 2 |
| 1973 | 2 |
| 1974 | 0 |
| 1975 | 0 |
| 1976 | 2 |
| 1977 | 2 |
| 1978 | 4 |
| 1979 | 2 |
| 1980 | 1 |
| 1981 | 2 |
| 1982 | 0 |
| 1983 | 0 |
| 1984 | 1 |
| 1985 | 0 |
| 1986 | 2 |
| 1987 | 1 |
| 1988 | 2 |
| 1989 | 2 |
| 1990 | 2 |
| 1991 | 2 |
| 1992 | 2 |
| 1993 | 1 |
| 1994 | 3 |
| 1995 | 1 |
| 1996 | 3 |
| 1997 | 10 |
| 1998 | 1 |
| 1999 | 2 |
| 2000 | 2 |
| 2001 | 1 |
| 2002 | 1 |
| 2003 | 1 |
| 2004 | 9 |
| 2005 | 1 |
| 2006 | 5 |
| 2007 | 4 |
| 2008 | 2 |
| 2009 | 13 |
| 2010 | 9 |
| 2011 | 15 |
| 2012 | 35 |
| 2013 | 38 |
| 2014 | 46 |
| 2015 | 23 |
| 2016 | 19 |
| 2017 | 33 |
| 2018 | 60 |
| 2019 | 86 |
| 2020 | 282 |
| 2021 | 495 |
| 2022 | 458 |
| 2023 | 734 |
| 2024 | 1,364 |
| 2025 | 1,104 |
| 2026 | 444 |
Show as a table
| Time of day | Sightings |
|---|---|
| 12 am | 64 |
| 1 am | 68 |
| 2 am | 59 |
| 3 am | 80 |
| 4 am | 44 |
| 5 am | 50 |
| 6 am | 50 |
| 7 am | 27 |
| 8 am | 27 |
| 9 am | 31 |
| 10 am | 31 |
| 11 am | 30 |
| 12 pm | 31 |
| 1 pm | 28 |
| 2 pm | 34 |
| 3 pm | 36 |
| 4 pm | 48 |
| 5 pm | 92 |
| 6 pm | 187 |
| 7 pm | 218 |
| 8 pm | 230 |
| 9 pm | 273 |
| 10 pm | 175 |
| 11 pm | 94 |
Where and what people see
- Roswell, New Mexico138 3%
- Phoenix, Arizona114 2%
- Area 51, Nevada90 2%
- Los Angeles, California83 2%
- Pacific Ocean off San Diego, United States59 1%
- White299
- Red186
- Orange162
- Black126
- Silver126
- Green109
- Blue83
- Multicolored74
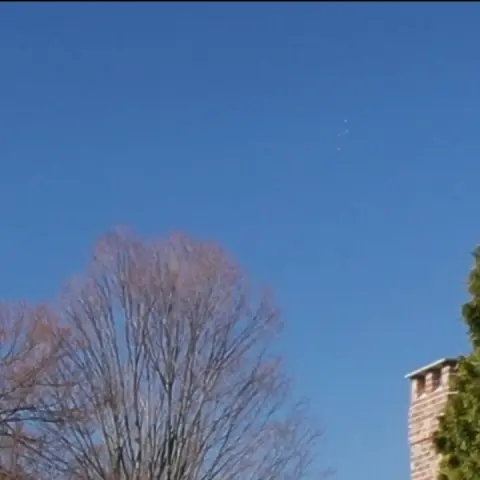
UFO videos from the United States


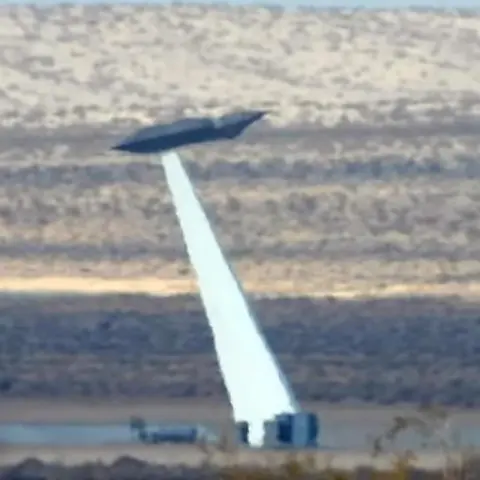
Latest UFO sightings in the United States



Every sighting in the United States → Browse with filters → 📊 Analysis
Questions about UFO sightings in the United States
How many UFO sightings have been reported in the United States?
5,387 sightings in the United States are on ufos.dev, from 1903 to 2026, with 549 in the last 12 months — 1.58 per 100,000 people.
Where in the United States are UFOs seen most?
The most reports come from Roswell, New Mexico (138), Phoenix, Arizona (114), Area 51, Nevada (90).
When are UFOs most often seen in the United States?
Most reports with a time are from around 9 pm local time; the busiest year so far was 2024.
What shapes of UFO are reported in the United States?
The most common are light (729), orb (620), triangle (216), sphere (133).
How do I report a UFO sighting in the United States?
Post it on ufos.dev with the date, time and place — it is checked against the sky that night (launches, satellites, planets, planes) and appears on the United States map. Report a sighting →
Other countries
Updated 13 November 2026. Population: World Bank. Places are worked out from what each report says, so a few may be missing or in the wrong place. Flags: flagcdn.com.